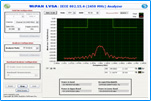
|

|
|
WiPAN LVSA-Tx Testing |
Overview
The WiPAN LVSA 2450 signal analysis solution is designed to capture,
measure, and analyze IEEE 802.15.4 compliant signals in the 2450 MHz
bands.
The Analyzer yields both raw and detailed measurements with complete
MAC information. It allows the user to take advantage of
high-efficiency testing and measurement by defining a suitable span,
trigger, attenuation, and reference levels.
WiPAN LVSA lets the user save the acquired IQ and MAC data
Analyzer is capable of capturing signals, performing symbol
synchronization, frequency synchronization, and neutralizing front-end
non idealities. The receiver performs EVM calculation as per the
standard’s specification.
In addition, colorful waveforms of data along with markers, zoom, and
other GUI options add a third dimension to signal analysis and
acquisitions.
WiPAN LVSA seamlessly integrates with the NI PXI RFSA 5660 vector
signal analyzer. Its powerful analysis capabilities help scientists,
engineers, and academicians to better understand the transmitter
characteristics of a ZigBee DUT.
The power of WiPAN LVSA helps save time, money, and speeds up the
development process while reducing associated development risks.
For engineers working with today’s emerging ZigBee technology,
SeaSolve’s signal analysis solution-WiPAN LVSA is an indispensable
tool for research, product development and product manufacturing.
|
|
|
|
Features |
|
|
|
Supported
frequency range |
|
|
|
|
|
2450/868/915
MHz |
|
|
|
|
Measurements |
|
|
|
|
|
RF
Measurements |
|
|
|
|
|
|
|
Power
spectral Density |
|
|
Occupied
bandwidth |
|
|
Power in
Upper and Lower Bands |
|
|
Power in
band (total power) |
|
|
|
|
|
|
Baseband
Measurements |
|
|
|
|
|
|
|
MAC
Information - Decoding of Frames |
|
|
|
|
|
|
•
|
Displays Frame, Sub Frame, and PAN type |
|
|
|
|
•
|
Power
Management status |
|
|
|
|
•
|
Decodes and displays FCS,
Destination and Source PAN
Addresses, Destination and Source PAN IDs |
|
|
|
|
•
|
Displays Encryption and
Acknowledgement Status |
|
|
|
|
•
|
Displays the entire Frame Body (MPDU) |
|
|
|
|
|
|
IQ Plots |
|
|
|
|
|
|
•
|
I plot |
|
•
|
IQ
plot |
|
•
|
Phase
Plot |
|
•
|
Magnitude plot |
|
|
|
|
|
|
Error
Vector Magnitude (EVM) |
|
|
Constellation |
|
|
Eye
Diagram |
|
|
CCDF |
|
|
Data bits |
|
|
Preamble
Detection |
|
|
Packet
Detection |
|
|
SFD
detection |
|
|
|
|
Saving options
|
|
|
|
|
|
Save IQ data
in .bin or .rtf format |
|
|
Save MAC data
in .rtf format |
|
|
|
|
Configurations |
|
|
|
|
|
Configure Span |
|
|
Configure
Trigger level |
|
|
Attenuation
and Reference Levels |
|
|
Acquisition
time |
|
|
|
|
Display
Parameters |
|
|
|
|
|
Frequency
Offset |
|
|
Frame Length |
|
|
EVM (in %rms) |
|
|
|
|
Extensive
Graphical capabilities |
|
|
|
|
|
User defined
plot color |
|
|
User defined
style of lines |
|
|
Zoom
|
|
|
Markers |
|
|
Auto Scale |
|
|
|
|
|
|
Set Up |
|

|
|
AWiPAN
LVSA Advantages |
| |
|
|
Characterize
overall physical layer characteristics of IEEE 802.15.4/ ZigBee
transmitters |
|
|
Real time capture
and plotting of IEEE 802.15.4 signals |
|
|
Elegant and easy
to use. |
|
|
Fast and accurate
analysis |
|
|
Designers can move
quickly from simulation domain to analysis of real world
802.15.4 signals |
|
|
Verification of
chipset designs |
|
|
Seamless
integration with NI PXI 5660 RFSA |
|
|
Quickly identify
and debug errors |
|
|
Diagnose RF
problems |
|
|
Analyze the
effects of impairments |
|
|
Aids each stage of
development and manufacturing to troubleshoot and identify
deviations from ideality. |
|
|
|
|
RF Measurements

Figure 1: RF Measurements: Power Spectrum
Plot, Occupied Bandwidth, Power in Upper and Lower bands |
|
|
|
Baseband Measurements |
|
|
|
|
IEEE 802.15.4/ZigBee
signal analysis solution is available for all three IEEE 802.15.4 radio
bands.
WiPAN LVSA 2450
To test, measure and analyze the performance of ZigBee transmitters
operating in the 2450 MHz band
WiPAN LVSA 868/915
To test, measure and analyze the performance of ZigBee transmitters
operating in the 868 and 915 MHz bands |
|
|
|
Request quote or Information
|
|
|